
About Me...!
Hello, I'm Zafran Ali Khan, an aspiring Data/Business Analyst and Power BI Developer.
Welcome to The Guiding Analyst, where I am dedicated to helping businesses grow through actionable insights and innovative solutions. My focus is on utilizing data to drive decision-making and enhance performance.
Explore my projects to see how I can assist your business in thriving within a data-driven landscape.
Data drives decisions; insights fuel success.
Explore my projects and services today!
Gallery
SERVICES

Tableau
I provide extensive insights into your raw data by leveraging Tableau for in-depth analysis and visualization from various perspectives, which enhances your decision-making process. My services encompass the development of interactive storytelling dashboards specifically designed to meet your business requirements.

Power BI
I offer comprehensive insights into your raw data by analyzing and visualizing it from multiple dimensions, enabling more effective decision-making. My services include the creation of interactive storytelling dashboards tailored to your business needs.

Data/Business Research & Analytics
I specialize in advanced Excel analytics, Power BI, Tableau, and SQL, providing data and business research services. I transform complex data into actionable insights to support decision-making and drive growth. My skills include in-depth analysis, data visualization, and strategic recommendations to help you leverage your data for effective business outcomes.
Project Section
Project 1
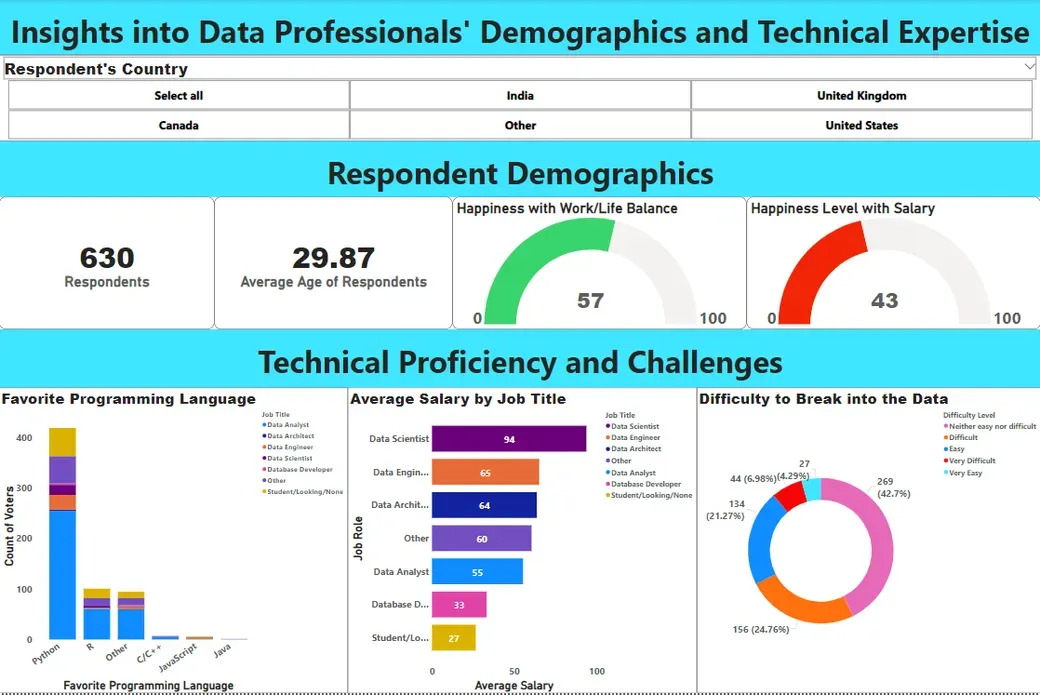
As a Data Analyst, I analyzed a survey dataset from 630 data professionals across several countries, including Canada, India, the UK, and the US. My goal was to uncover key insights into their demographics, technical skills, and challenges in the field.
Respondent Demographics
The data revealed that the average age of respondents is 29.87. The work-life balance satisfaction scored 57 out of 100, while salary satisfaction was lower at 43, indicating room for improvement in compensation across the industry.
Technical Skills
When it comes to programming languages, Python was the clear favorite, used by over 400 respondents, confirming its dominance in the data industry. Other languages like R and C/C++ were less popular.
I also analyzed average salaries by job role, with Data Scientists earning the highest average salary (94 units), followed by Data Engineers (65 units), while Database Developers and students had lower pay.
Challenges
42.76% found entering the data field manageable; 21.27% faced challenges.
Project 2
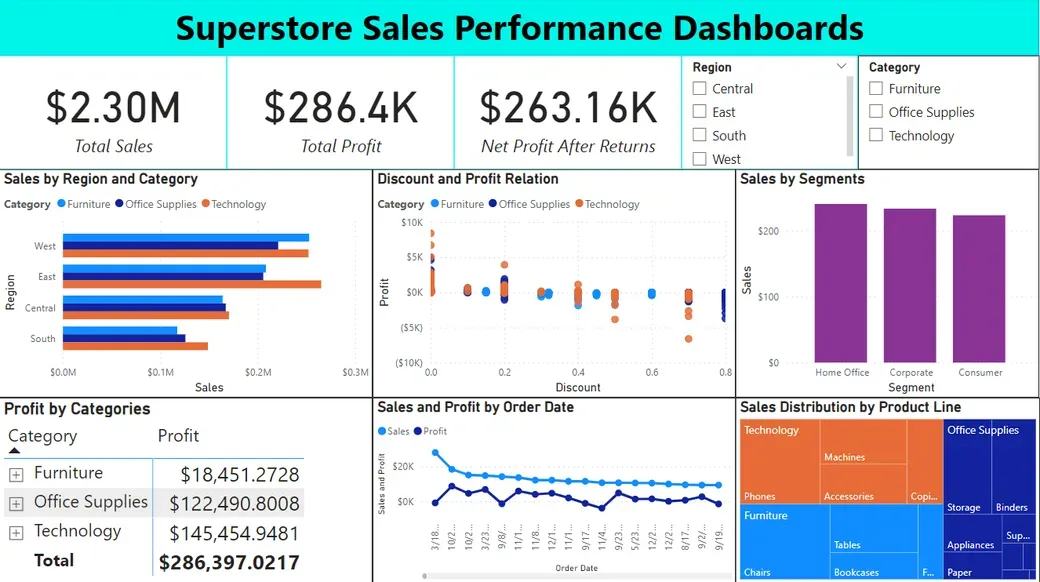
Using Power BI, I created a dynamic dashboard to visualize Superstore's sales performance, providing actionable insights for decision-making.
Key Highlights:
Total Sales: $2.30M | Total Profit: $286.4K | Net Profit: $263.16K
Top Region: West, excelling in Furniture and Technology
Profit by Category: Technology leads with $145.45K, while Furniture lags at $18.45K
Discount Impact: Profits remain stable despite discount variations
Top Customer Segments: Corporate and Consumer, with Home Office trailing
Sales Trend: Consistent performance over time
This dashboard tells a clear story of profitability, regional strengths, and customer engagement, showcasing my ability to turn raw data into strategic insights for better business outcomes.
Project 3
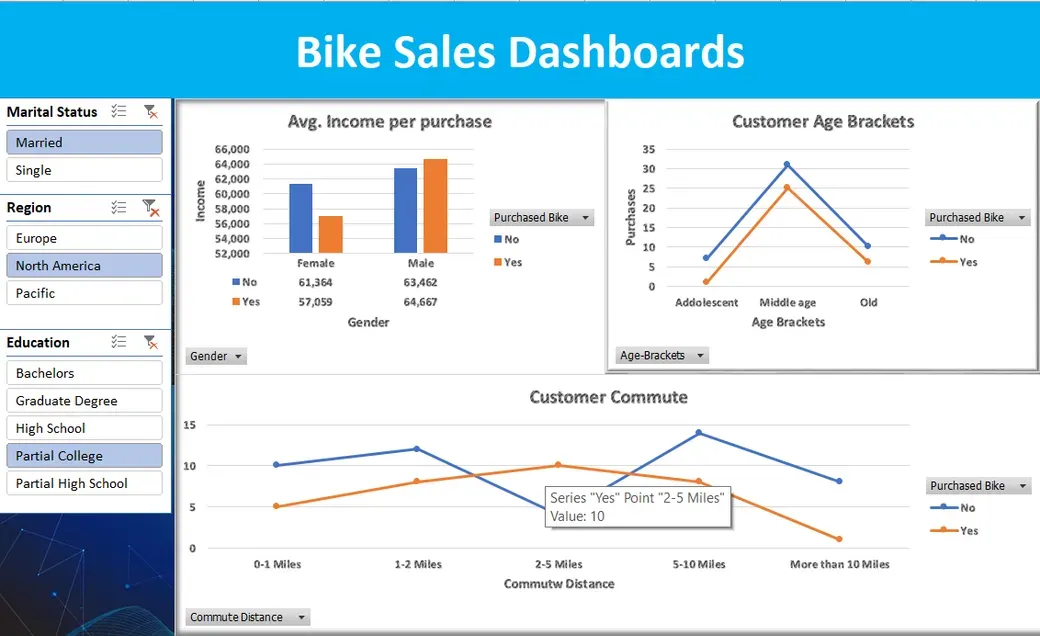
I analyzed the key factors influencing bike purchases, using demographic and commute data to uncover patterns in customer behavior.
Insights Uncovered:
Income and Gender Impact:
Males with an average income of $64,667 are more likely to purchase bikes, while females with an income of $61,364 also show interest but with a slightly lower purchase rate. Interestingly, those who didn't purchase bikes had lower incomes across both genders.
Age Bracket Trends:
Middle-aged customers dominate bike purchases, as shown by the spike in this age bracket, compared to adolescents and older adults, who show a lesser inclination to buy.
Customer Commute Behavior:
The data reveals that most customers purchasing bikes commute between 2-5 miles, while those commuting shorter or longer distances tend not to buy as frequently.
This dashboard highlights how income, age, and commute distance influence bike purchases, offering targeted marketing opportunities for middle-aged customers commuting 2-5 miles.
Project 4
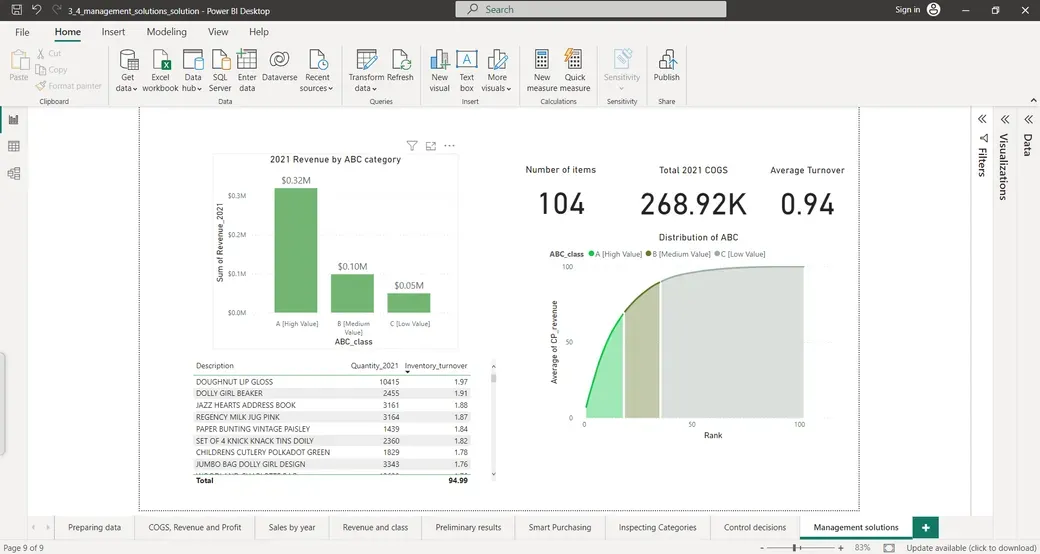
This dashboard provides an analytical overview of 2021 revenue, categorized by ABC analysis (High, Medium, and Low value items), along with cost of goods sold (COGS) and inventory turnover.
Key Insights:
Revenue by ABC Category:
High-Value Items (A): Generated the majority of the revenue at $0.32M.
Medium-Value Items (B): Contributed $0.10M.
Low-Value Items (C): Added $0.05M to total revenue.
Inventory Turnover:
A total of 104 items were analyzed, with an average turnover rate of 0.94.
COGS and Distribution:
Total COGS amounted to $268.92K, and the distribution curve shows how the high-value (A) items make up the bulk of revenue, following the Pareto principle.
This dashboard guides efficient inventory management and highlights revenue concentration on high-value items, helping to prioritize purchasing and inventory strategies.