
Dashboards That Win
At Rank One Analytics, we transform complex data into clear, actionable insights through custom Power BI dashboards. Empower your business decisions with precision and simplicity. Book your free strategy session today and start turning your data into your greatest asset.
Our Services

Starter Dashboard
$1995
Perfect for small teams or single-department needs.
What you get:
1 custom Power BI dashboard (up to 3 reports)
Connects to 1–2 data sources
Basic KPIs & visuals for quick insights
1 feedback cycle for refinement
Training session to get your team started
Ideal for: Teams wanting faster reporting, clearer visibility, and actionable metrics.
Growth Dashboard
$4995
For businesses ready to scale their analytics across departments.
What you get:
Up to 3 dashboards (10+ visuals each)
Connects to 3–5 data sources
Advanced KPIs & actionable metrics
Scheduled refresh & sharing setup
2 feedback cycles
30 days of support & training
Ideal for: Companies tracking multiple departments or projects, and executives needing clear, consolidated reporting.

Analytics Partner
$2495/mo
Ongoing analytics support for businesses that rely on data to win.
What you get:
Continuous dashboard monitoring & optimization
Monthly review calls to track KPIs and opportunities
Data refresh troubleshooting & small dashboard tweaks
Proactive insights highlighting risks & opportunities
Executive-ready reports and presentations
Custom automations & workflow improvements
Dedicated analyst hours each week
Priority support and fast turnaround
Ideal for: Businesses looking for a hands-on analytics partner to ensure data drives decisions every month.
💡Limited client slots available to ensure premium service and personalized attention.
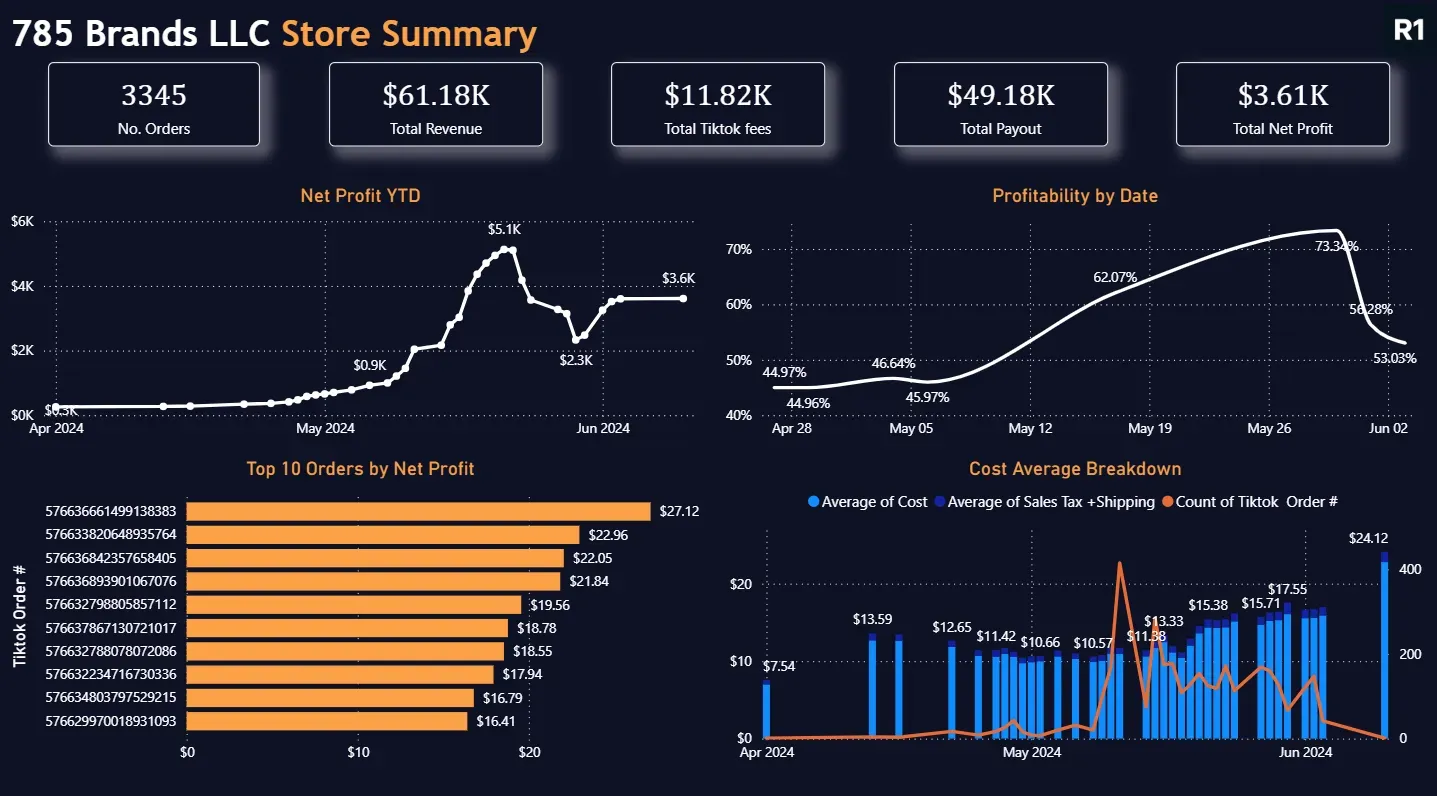
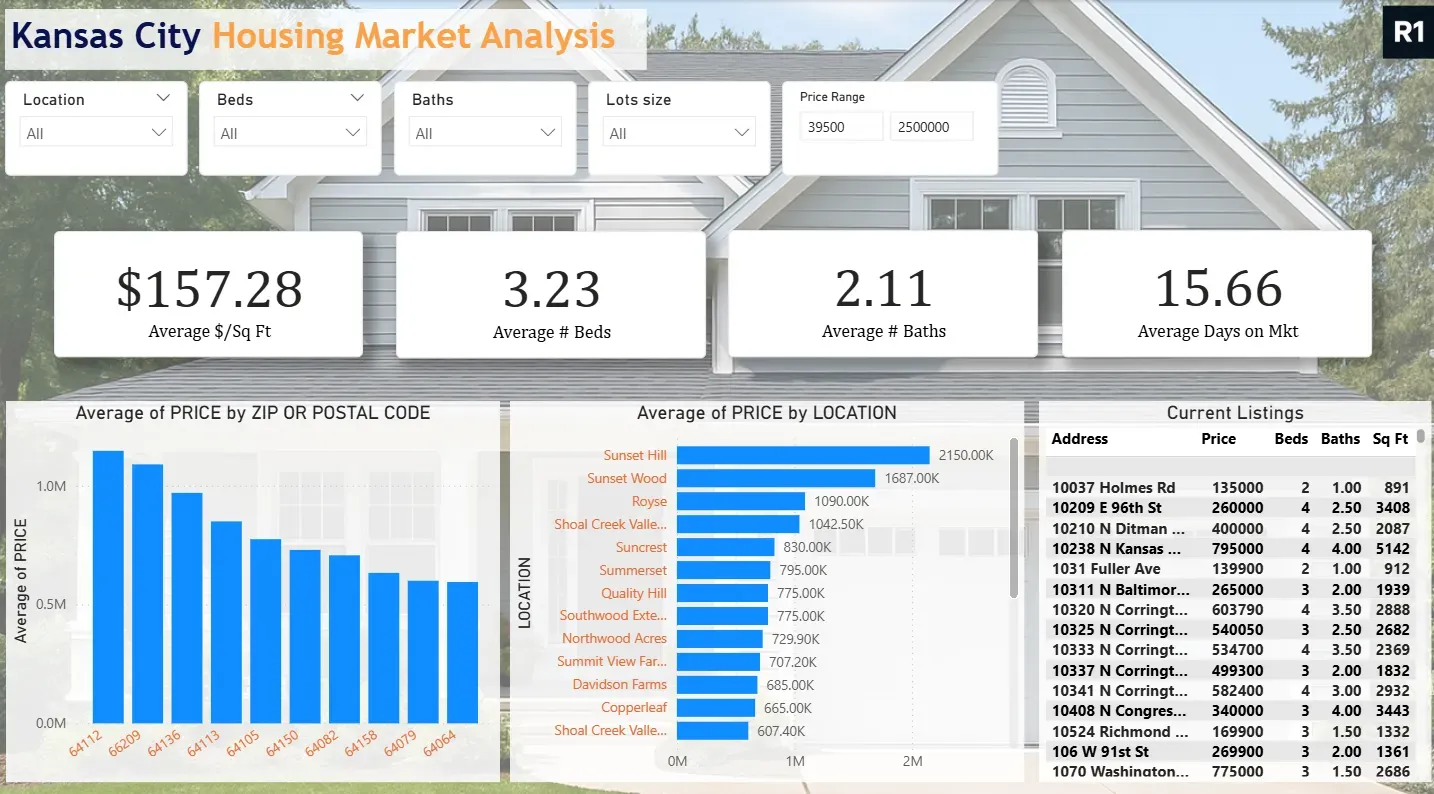
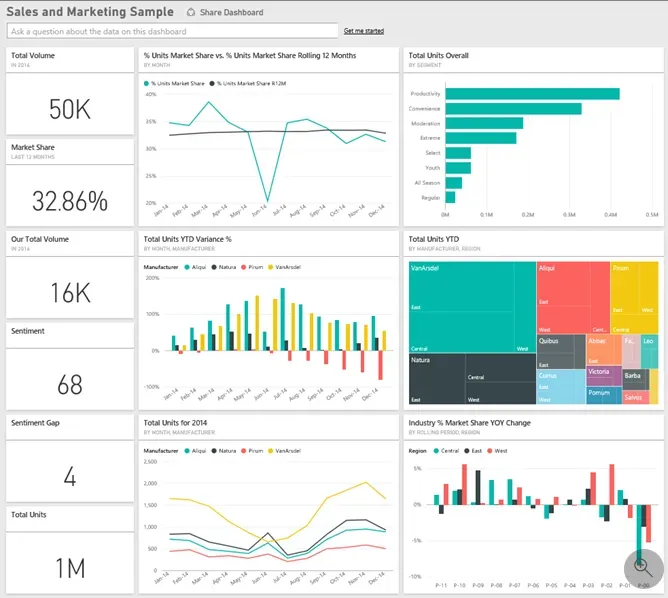
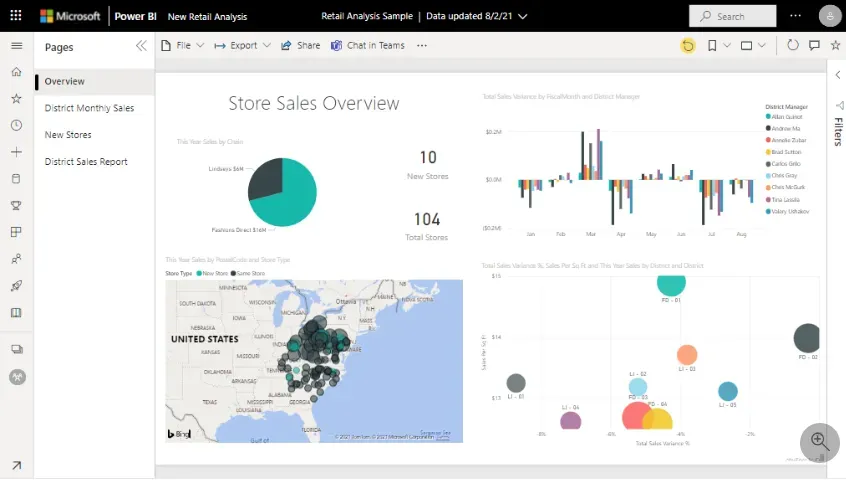
Gallery


Why Rank One Analytics?
Discover insights today!
Faster decisions: Reduce hours spent manually reporting
Actionable insights: Stop guessing, start acting
Professional dashboards: Executive-ready, easy to understand
Ongoing support: We don’t just build dashboards—we help you use them
Frequently Asked Questions
What is a Power BI dashboard?
A Power BI dashboard is an interactive data visualization tool that consolidates key metrics and KPIs into a single, easy-to-understand interface, helping executives and business owners make informed decisions quickly.
How can I get started with Rank One Analytics?
You can book a free strategy session through our website to discuss your business needs and discover how our dashboard solutions can help turn your data into clear, actionable insights.
How long does it take to build a dashboard?
Typically, a custom Power BI dashboard takes between 2 to 4 weeks to design, develop, and deploy, depending on the complexity and the number of data sources involved.